Tutorial
In addition, a tutorial describing the individual steps, options, and results is provided below.
|
On the main page, you can either start a new job by uploading a dataset ("Submit new job") or display the results of an earlier submitted job ("Open job results") by entering the respective job id. Please note that jobs will be deleted after a certain period of time. Should you require your job to persist longer, please contact us. |
 |
|
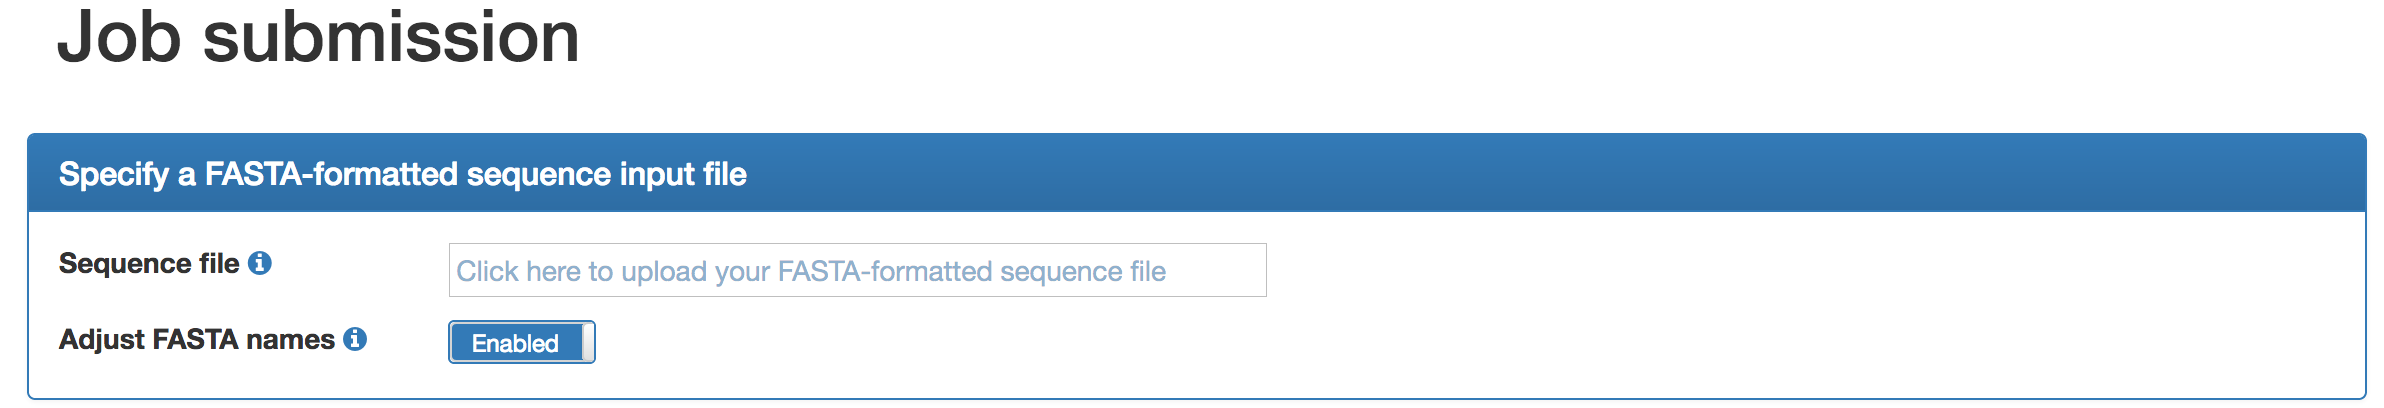
On the job submission page, click on the input field ("Click here to upload your FASTA-formatted sequence file"). A window will open which you can use to navigate to the folder containing your FASTA-formatted input sequences (assembled contigs or long reads). Please note that we have established file size constraints. By default, sequence names will be renamed in ascending order, in particular to make sure that the names are unique and that they are short enough for Prokka, which is important should you wish to perform a functional annotation (see below). However, if you are sure that the sequence names are shorter than 20 characters, you can disable this option and BusyBee Web will preserve the original names. |
 |
| A job name can be provided and we actually encourage to specify one as a short reminder of the dataset or parameter choice specified upon submission, especially if multiple jobs have been submitted by you. |  |
|
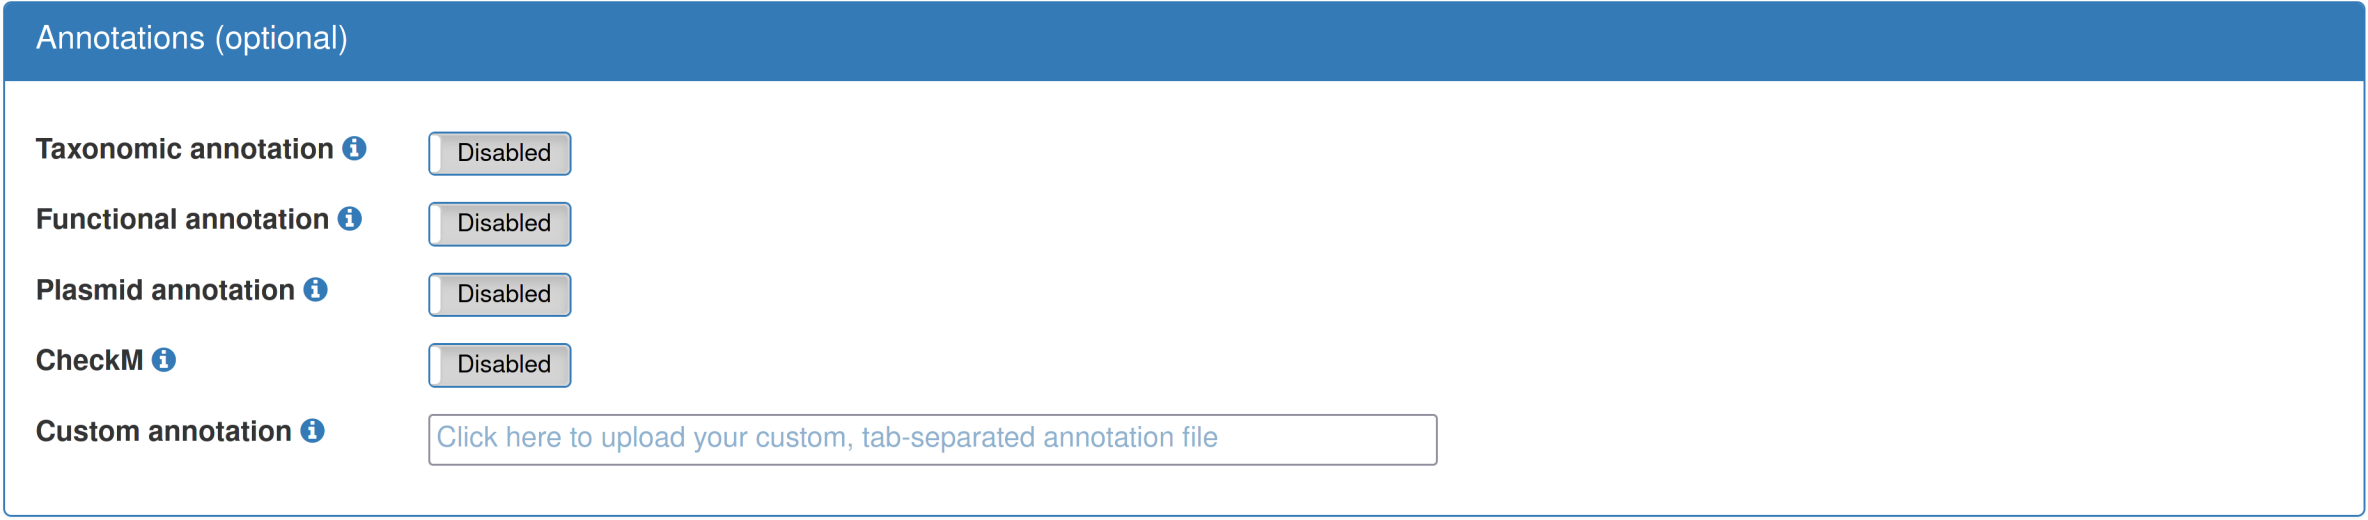
Optionally, various annotations of the provided data can be performed. Currently, the "functional annotation" includes annotation of antibiotic resistance genes via Resfams, and the "taxonomic annotation" uses Kraken to assign individual sequences to representatives in the MiniKraken database. Custom, per-sequence annotations can be provided, either for all sequences or just a subset. The custom annotations should be categorical and not have more than 20 levels. |
 |
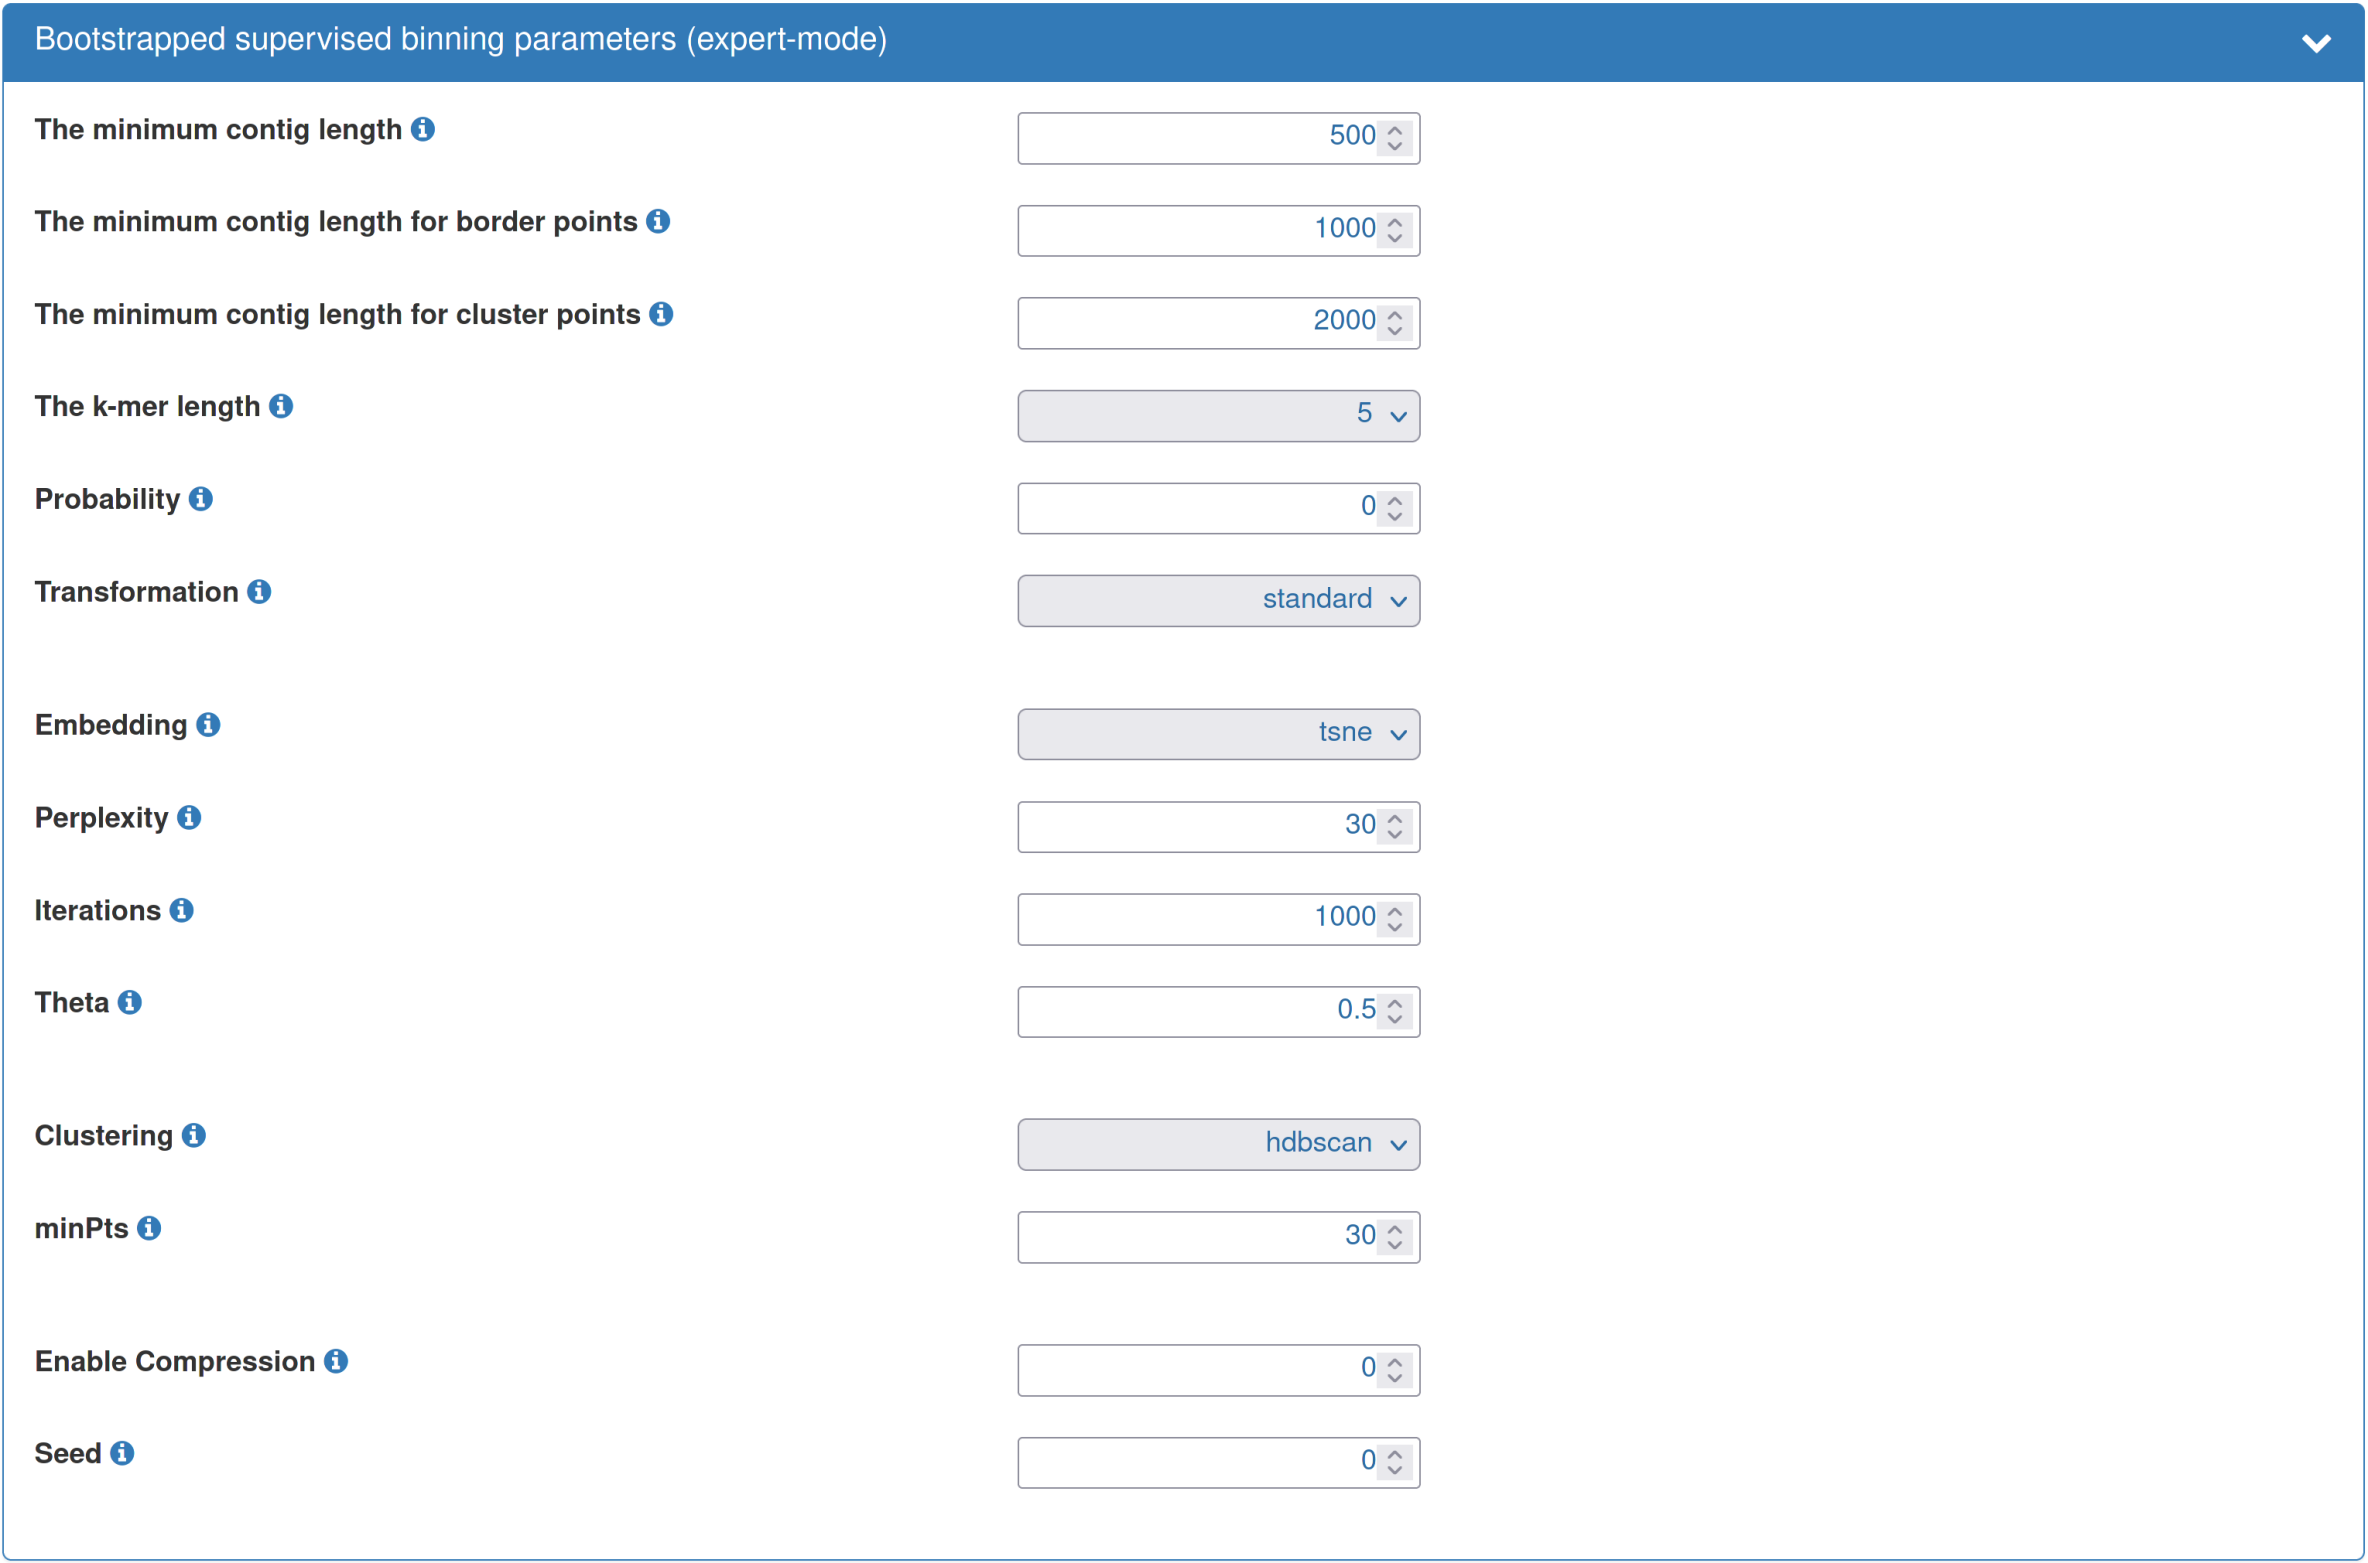
| Typically, the default parameters for the bootstrapped supervised binning are a good starting point. However, you can adjust the parameters according to your needs. For example, given a dataset of "low" diversity, the cluster point threshold can be reduced to "500". This will result in all sequences ≥ 500bp to be visualized and clustered instead of the default of 2,000 bp. As another example, you could increase the "probability threshold". This is expected to increase the precision, however, at the cost of reducing the sensitivity. As a final example, given a particularly large dataset, increasing the "Enable compression" value, e.g., to 1, will result in the clustering and visualization being performed on a compressed dataset, here compressed to about 50%, which will greatly accelerate the binning step. This is also an interesting option when performing an initial inspection of a dataset. |
 |
| The BusyBee webserver will perform checks on your input and on the chosen parameters. As soon as this test is passed, the "Check parameters and submit" button will become active, indicated by a change into more opaque green colour |  |
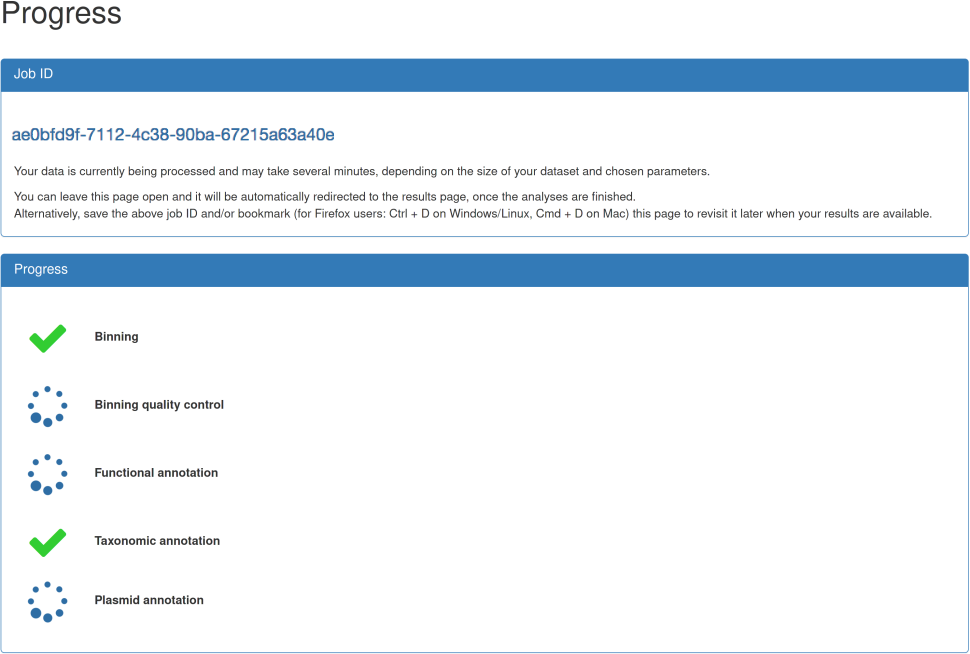
| After submission, you will be automatically forwarded to the job progress page. This page provides information about the status of the individual steps, e.g., binning or functional annotation. Moreover, a job ID is shown which can be used to retrieve results at a later point of time, i.e., you are not required to keep the progress page open. An email notification option is currently under development. As soon as all steps are finished, you are automatically forwarded to the results page. In case of any of the steps failing, please contact the administrator and provide your job id. However, as long as the binning step is successful, you are forwarded to the results page. |
 |
|
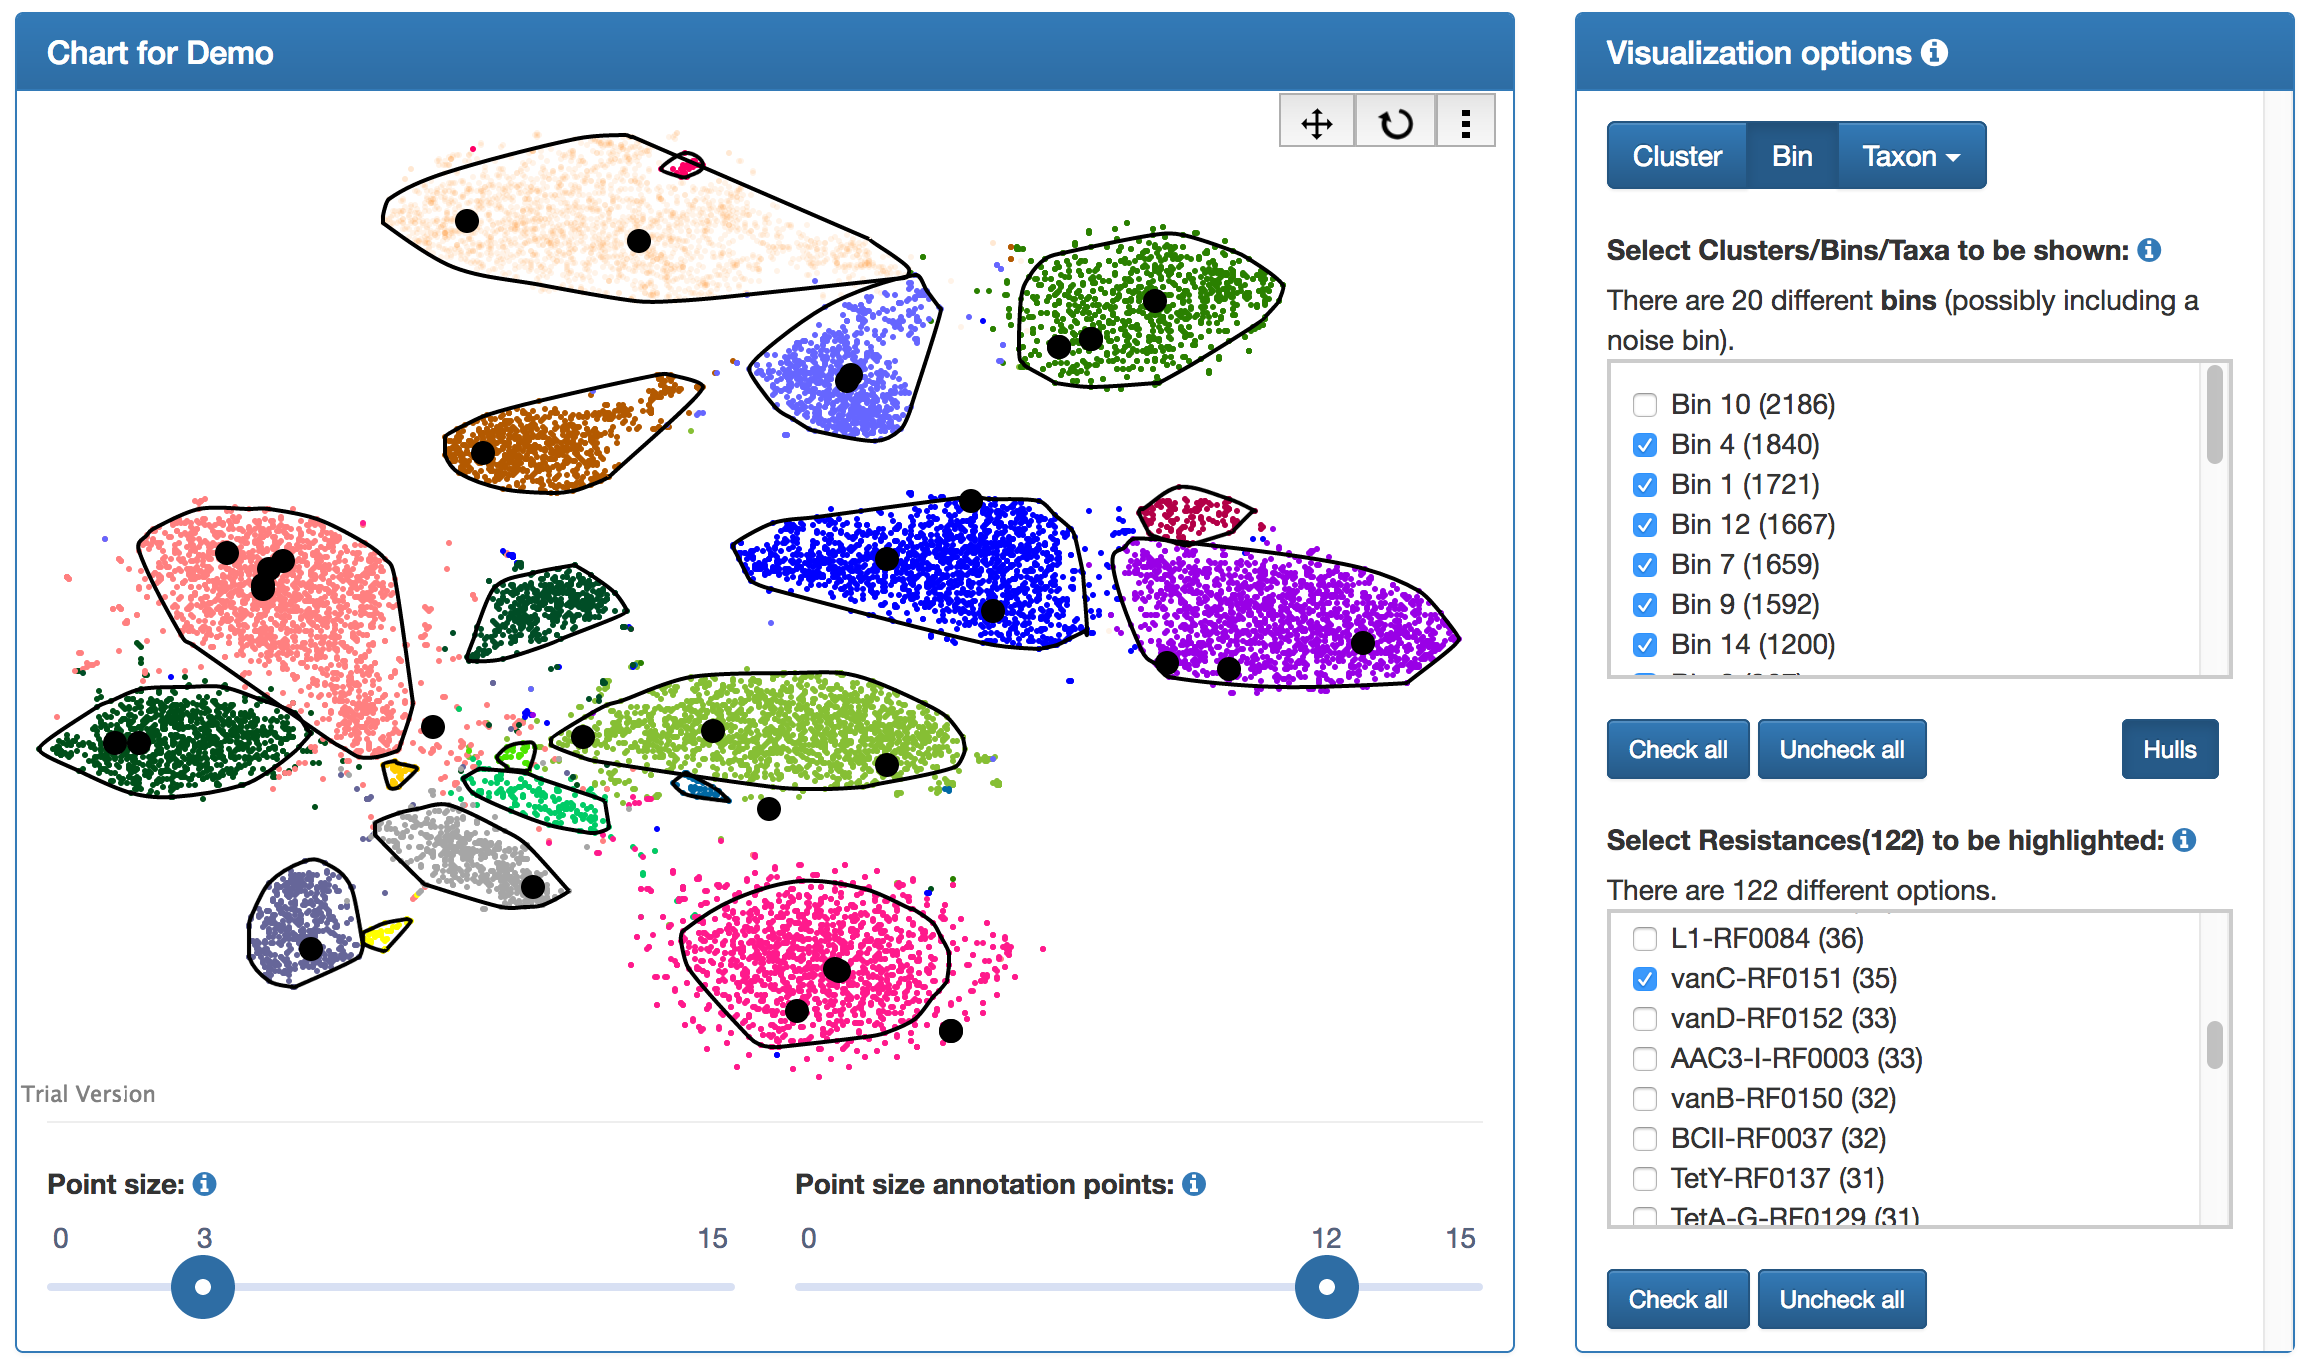
The results page includes visualizations for the individual analysis results. The two-dimensional scatter plot displays the two-dimensional embedding of the sequences' genomic signatures. Moreover, the clustering results are shown. The quality of the automated clustering can thus be inspected. In particular, "overcomplete" bins, i.e., bins which have been aggregated despite them being clearly separate clusters, or "missed" bins, i.e., clusters which have not been identified by the automated clustering algorithm, can be easily identified.
|
 |
| The sequence number distribution chart shows the number of sequences assigned to each cluster/bin. | 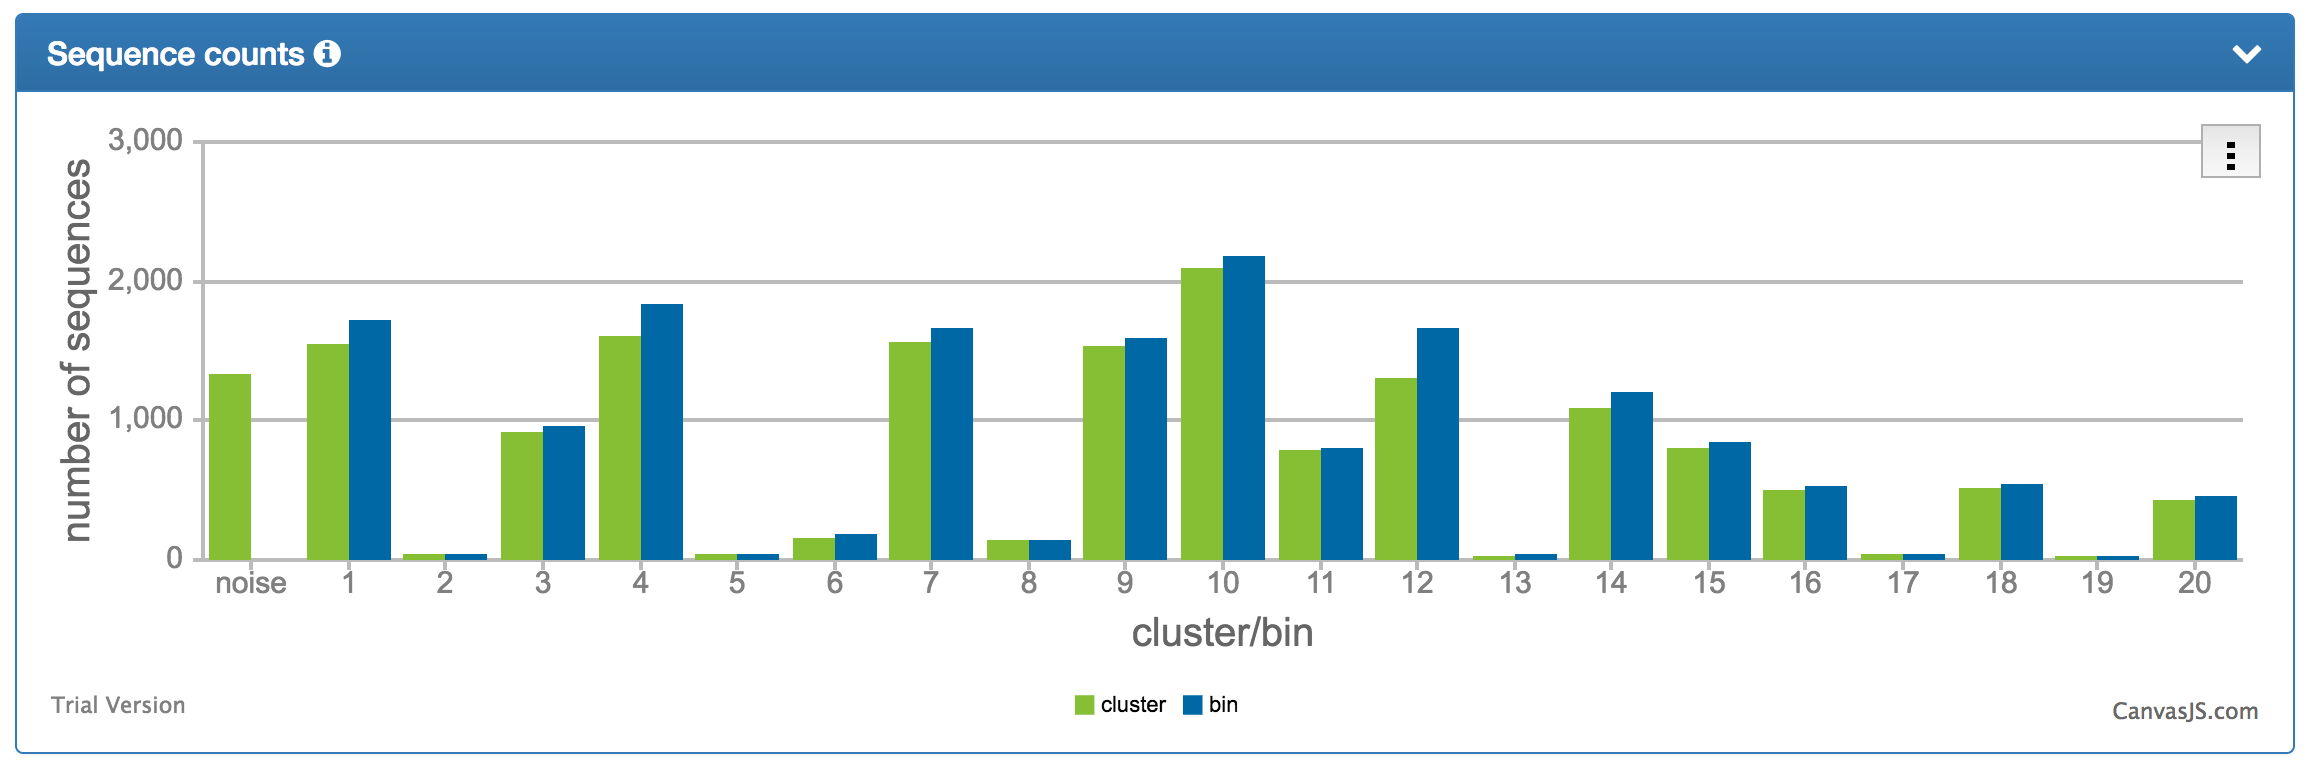 |
| The bin quality chart shows the degrees of completeness, contamination, and strain heterogeneity for the individual bins. Contaminated bins can quickly be identified and it can be assessed whether the contamination is due to eerrors in the clustering (high contamination + low strain heterogeneity) or due to similar strains being correctly assigned to the same bin (high contamination + high strain heterogeneity). | 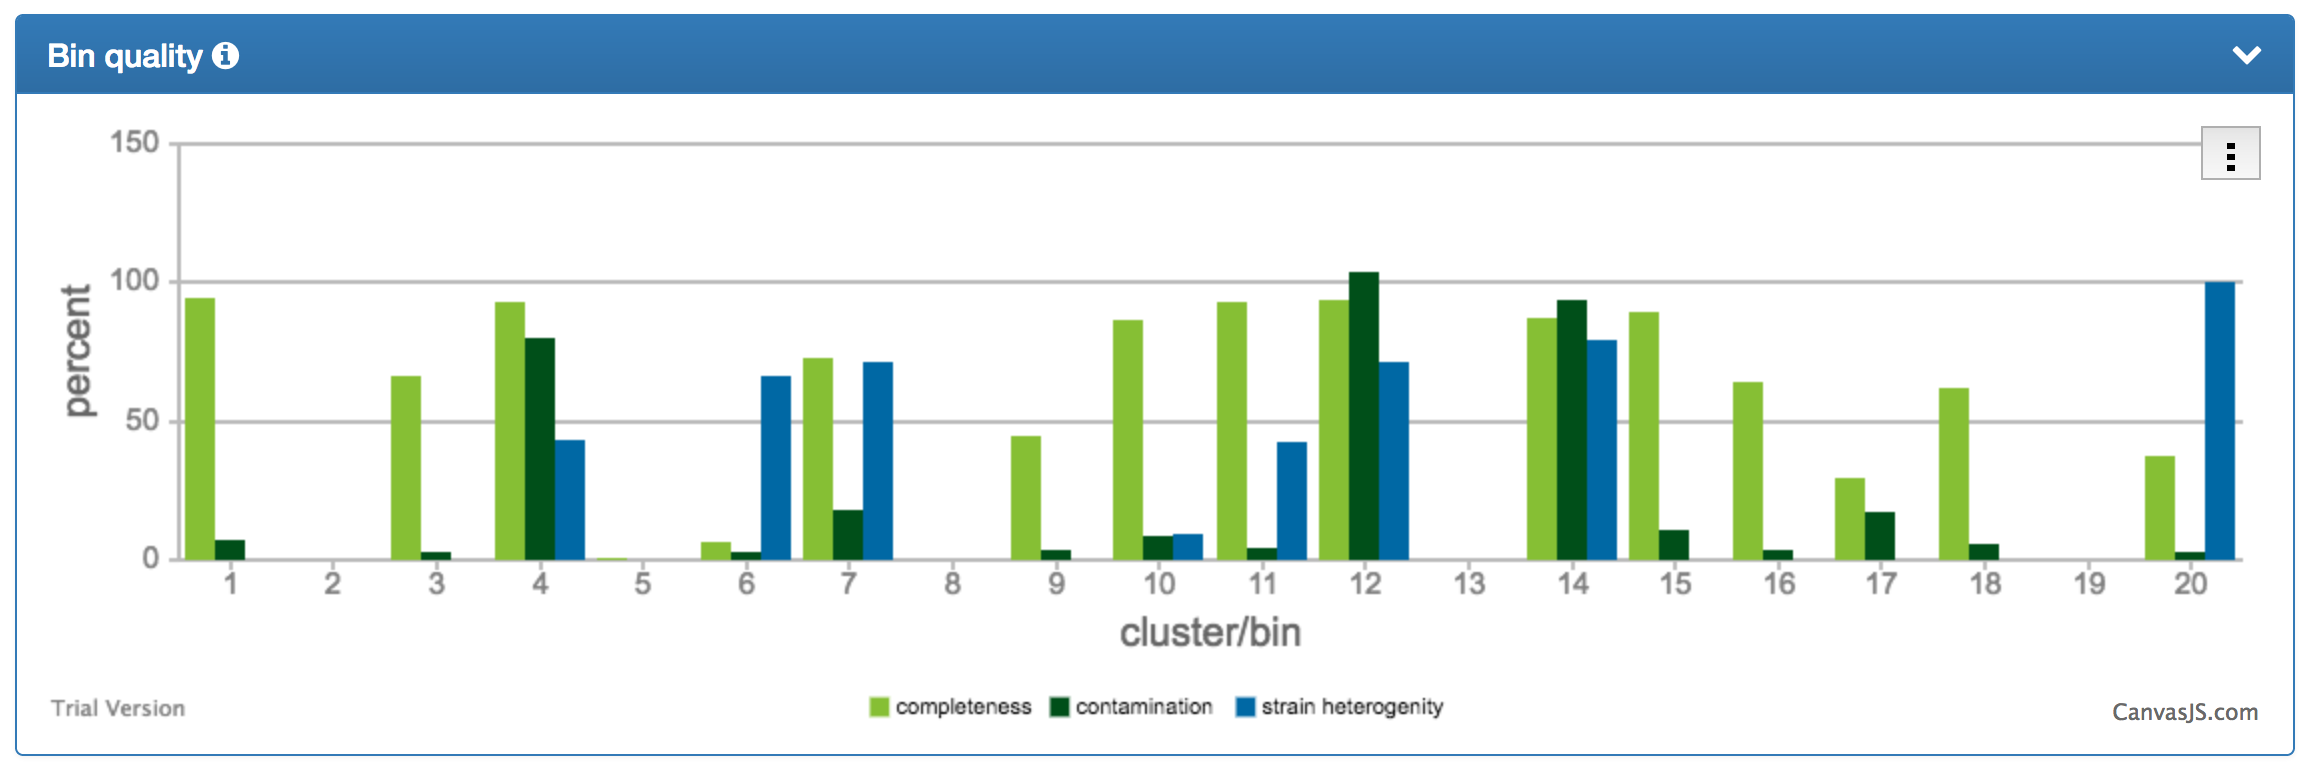 |
| In addition to the bin quality chart, a tabular representation is provided (truncated version is shown). The individual bins can be sorted according to their degrees of completeness, contamination, or strain heterogeneity. | 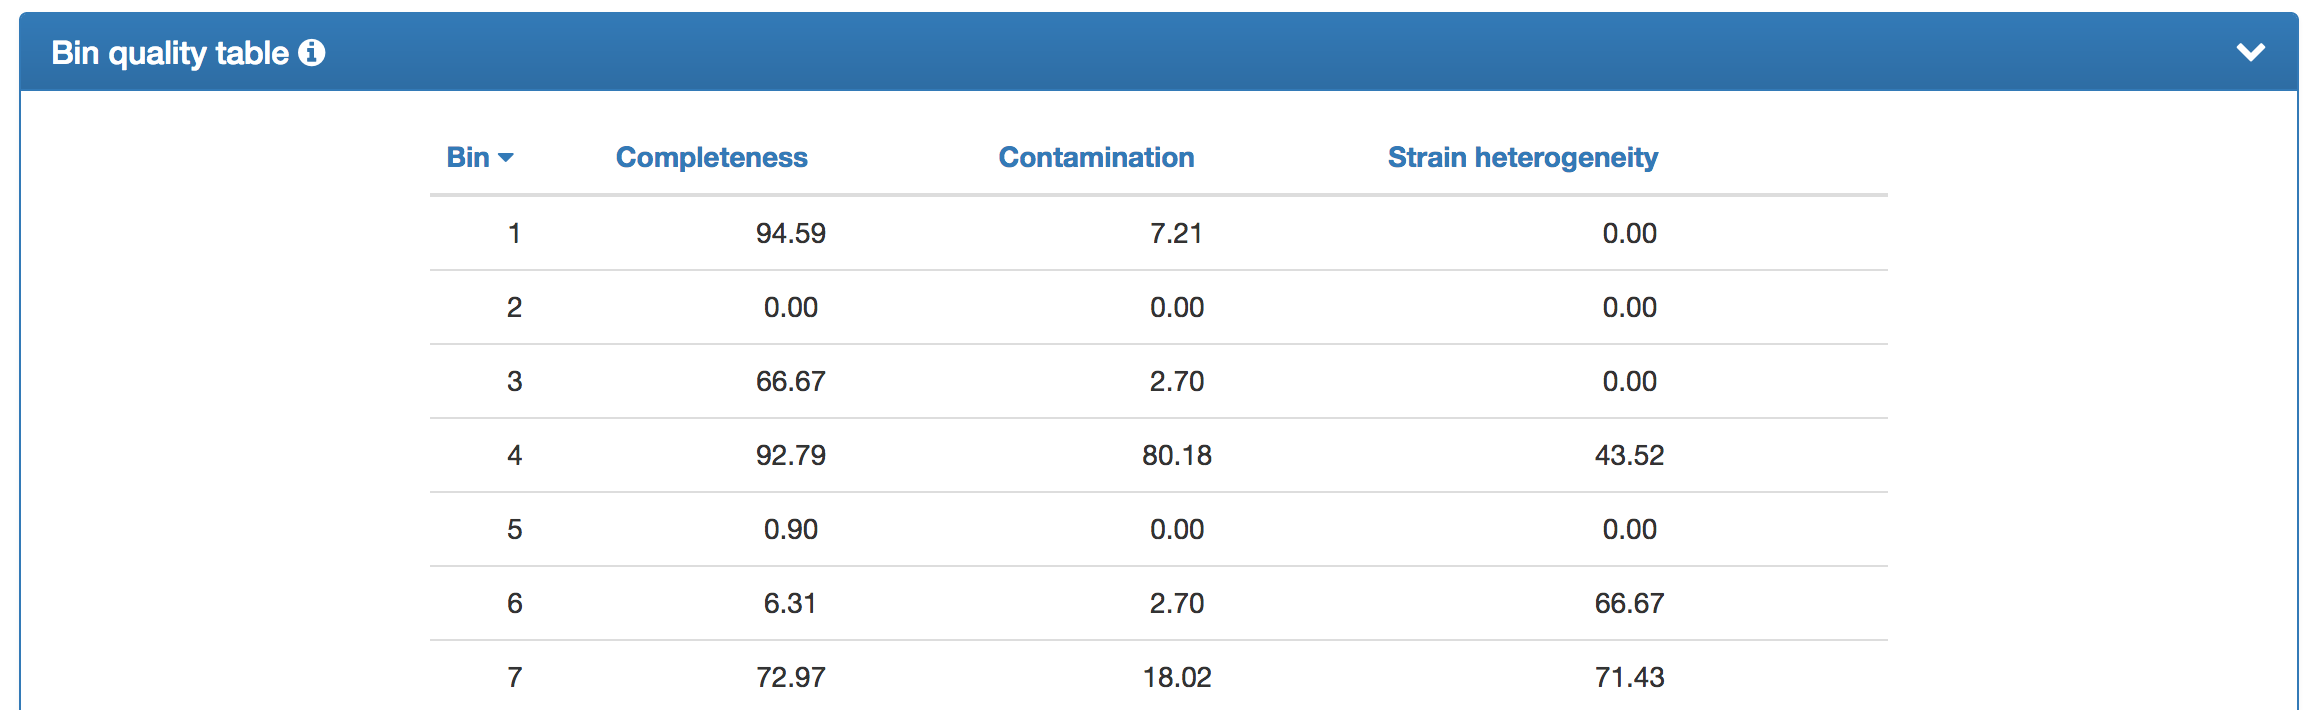 |
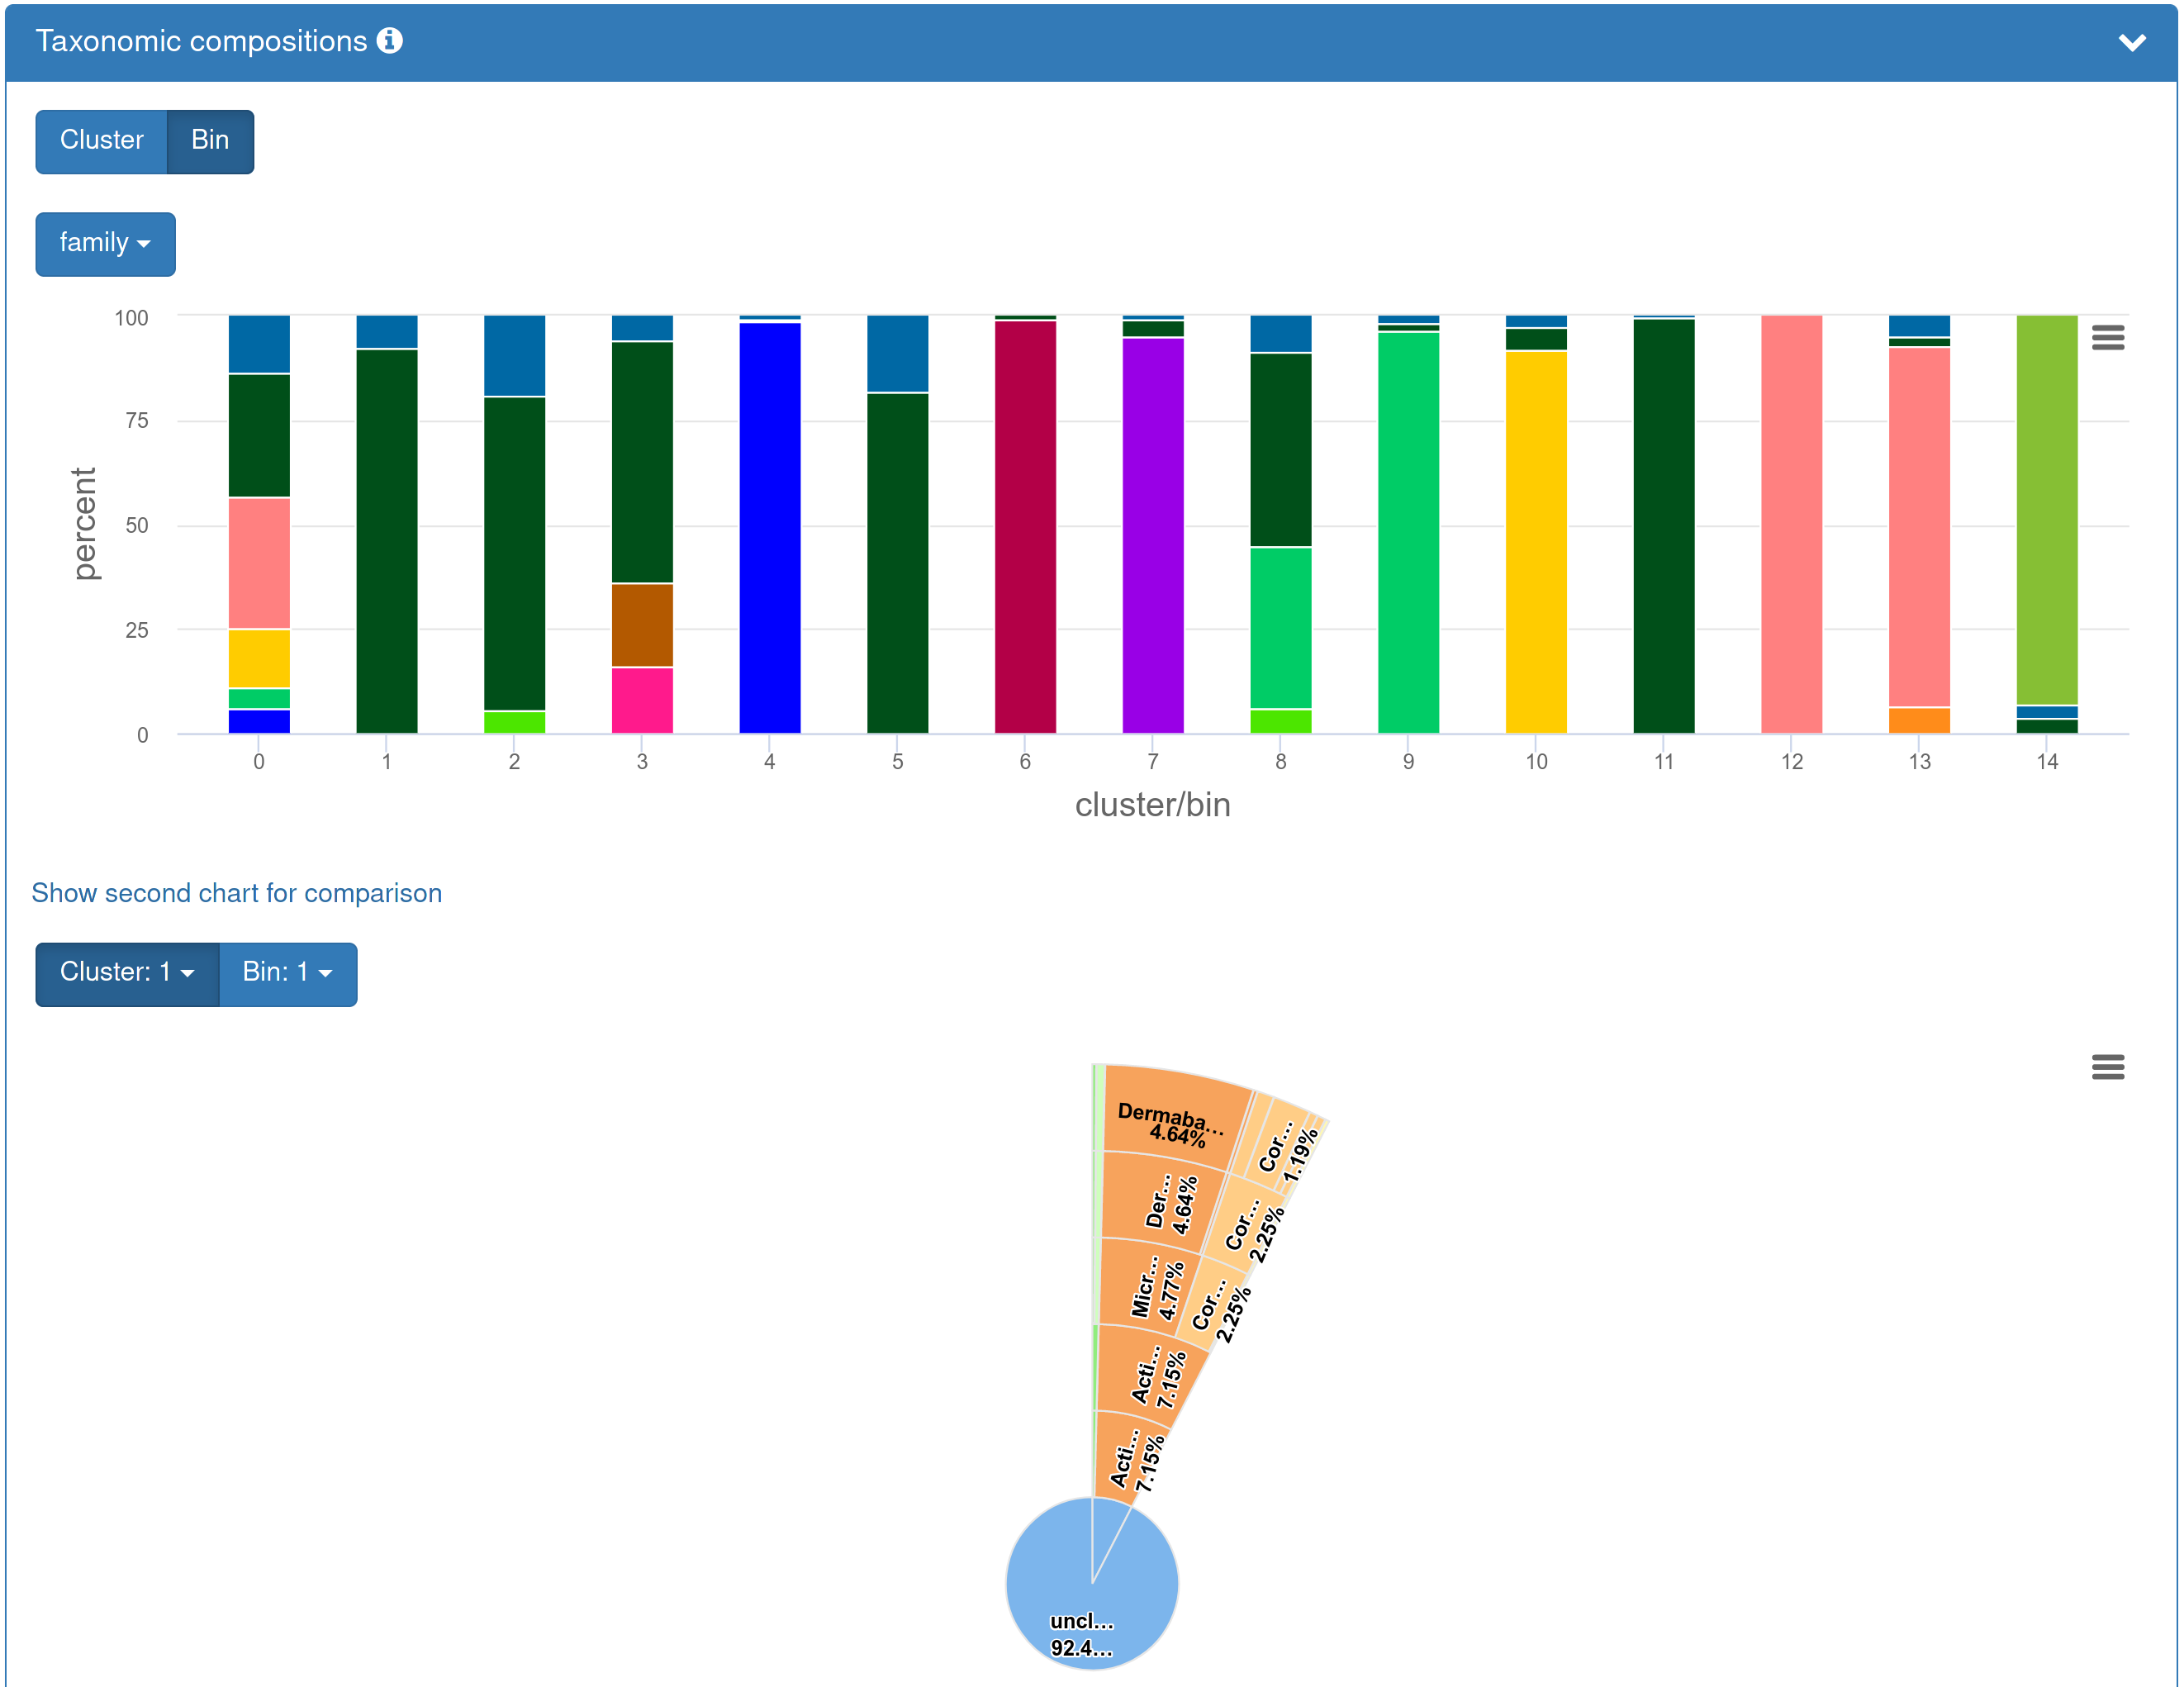
| If you opted in to the taxonomic annotation, the results page presents an overview of the taxonomic composition of the individual bins as percent bar charts. The taxonomic rank at which the composition is shown can be chosen. A second chart can be expanded to compare the taxonomic composition of the individual bins at different taxonomic ranks, e.g., genus vs. family (expanded version shown). An interactive sunburst plot visualizing individual bins or clusters may be preferred as an alternative representation with higher resolution. |
 |
| If you opted in to the plasmid annotation, the results page presents an overview of the plasmids found within your submitted dataset. Hyperlinks within the table forward to the respective plasmids in PLSDB. | 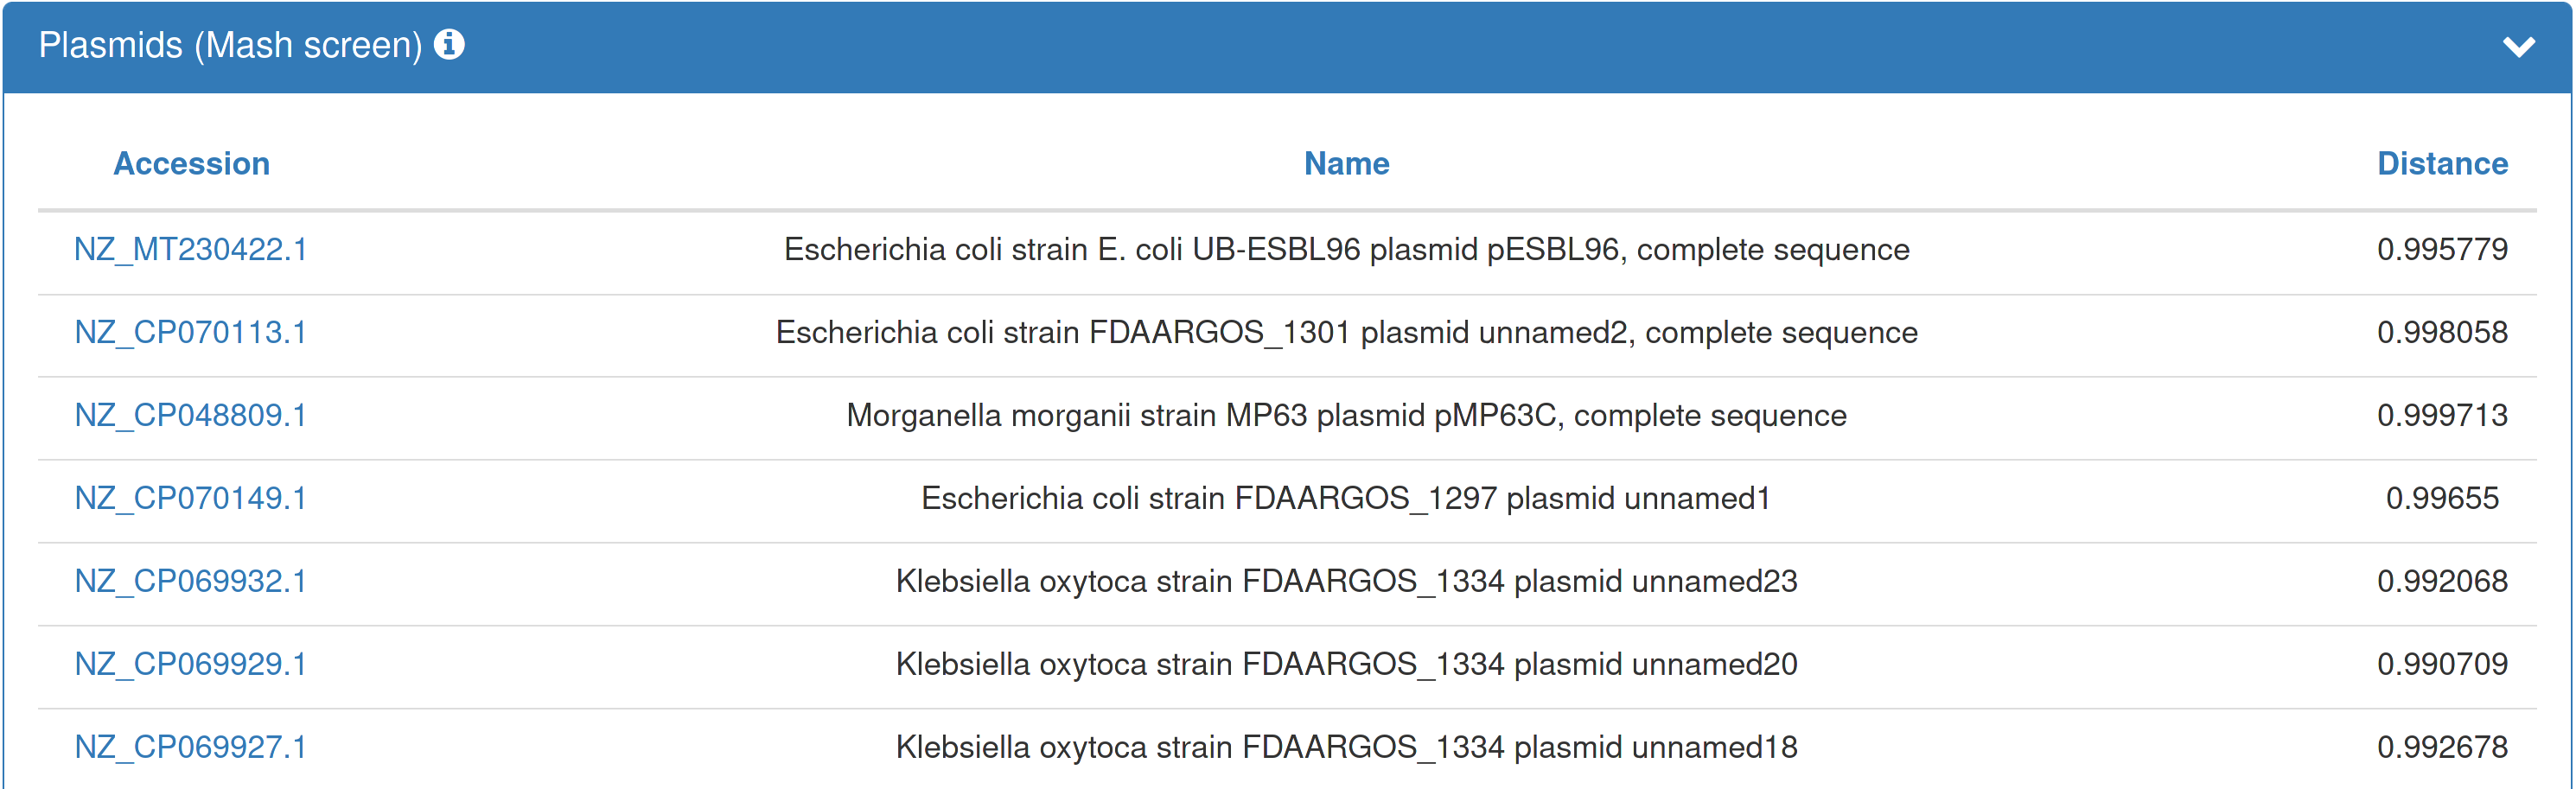 |
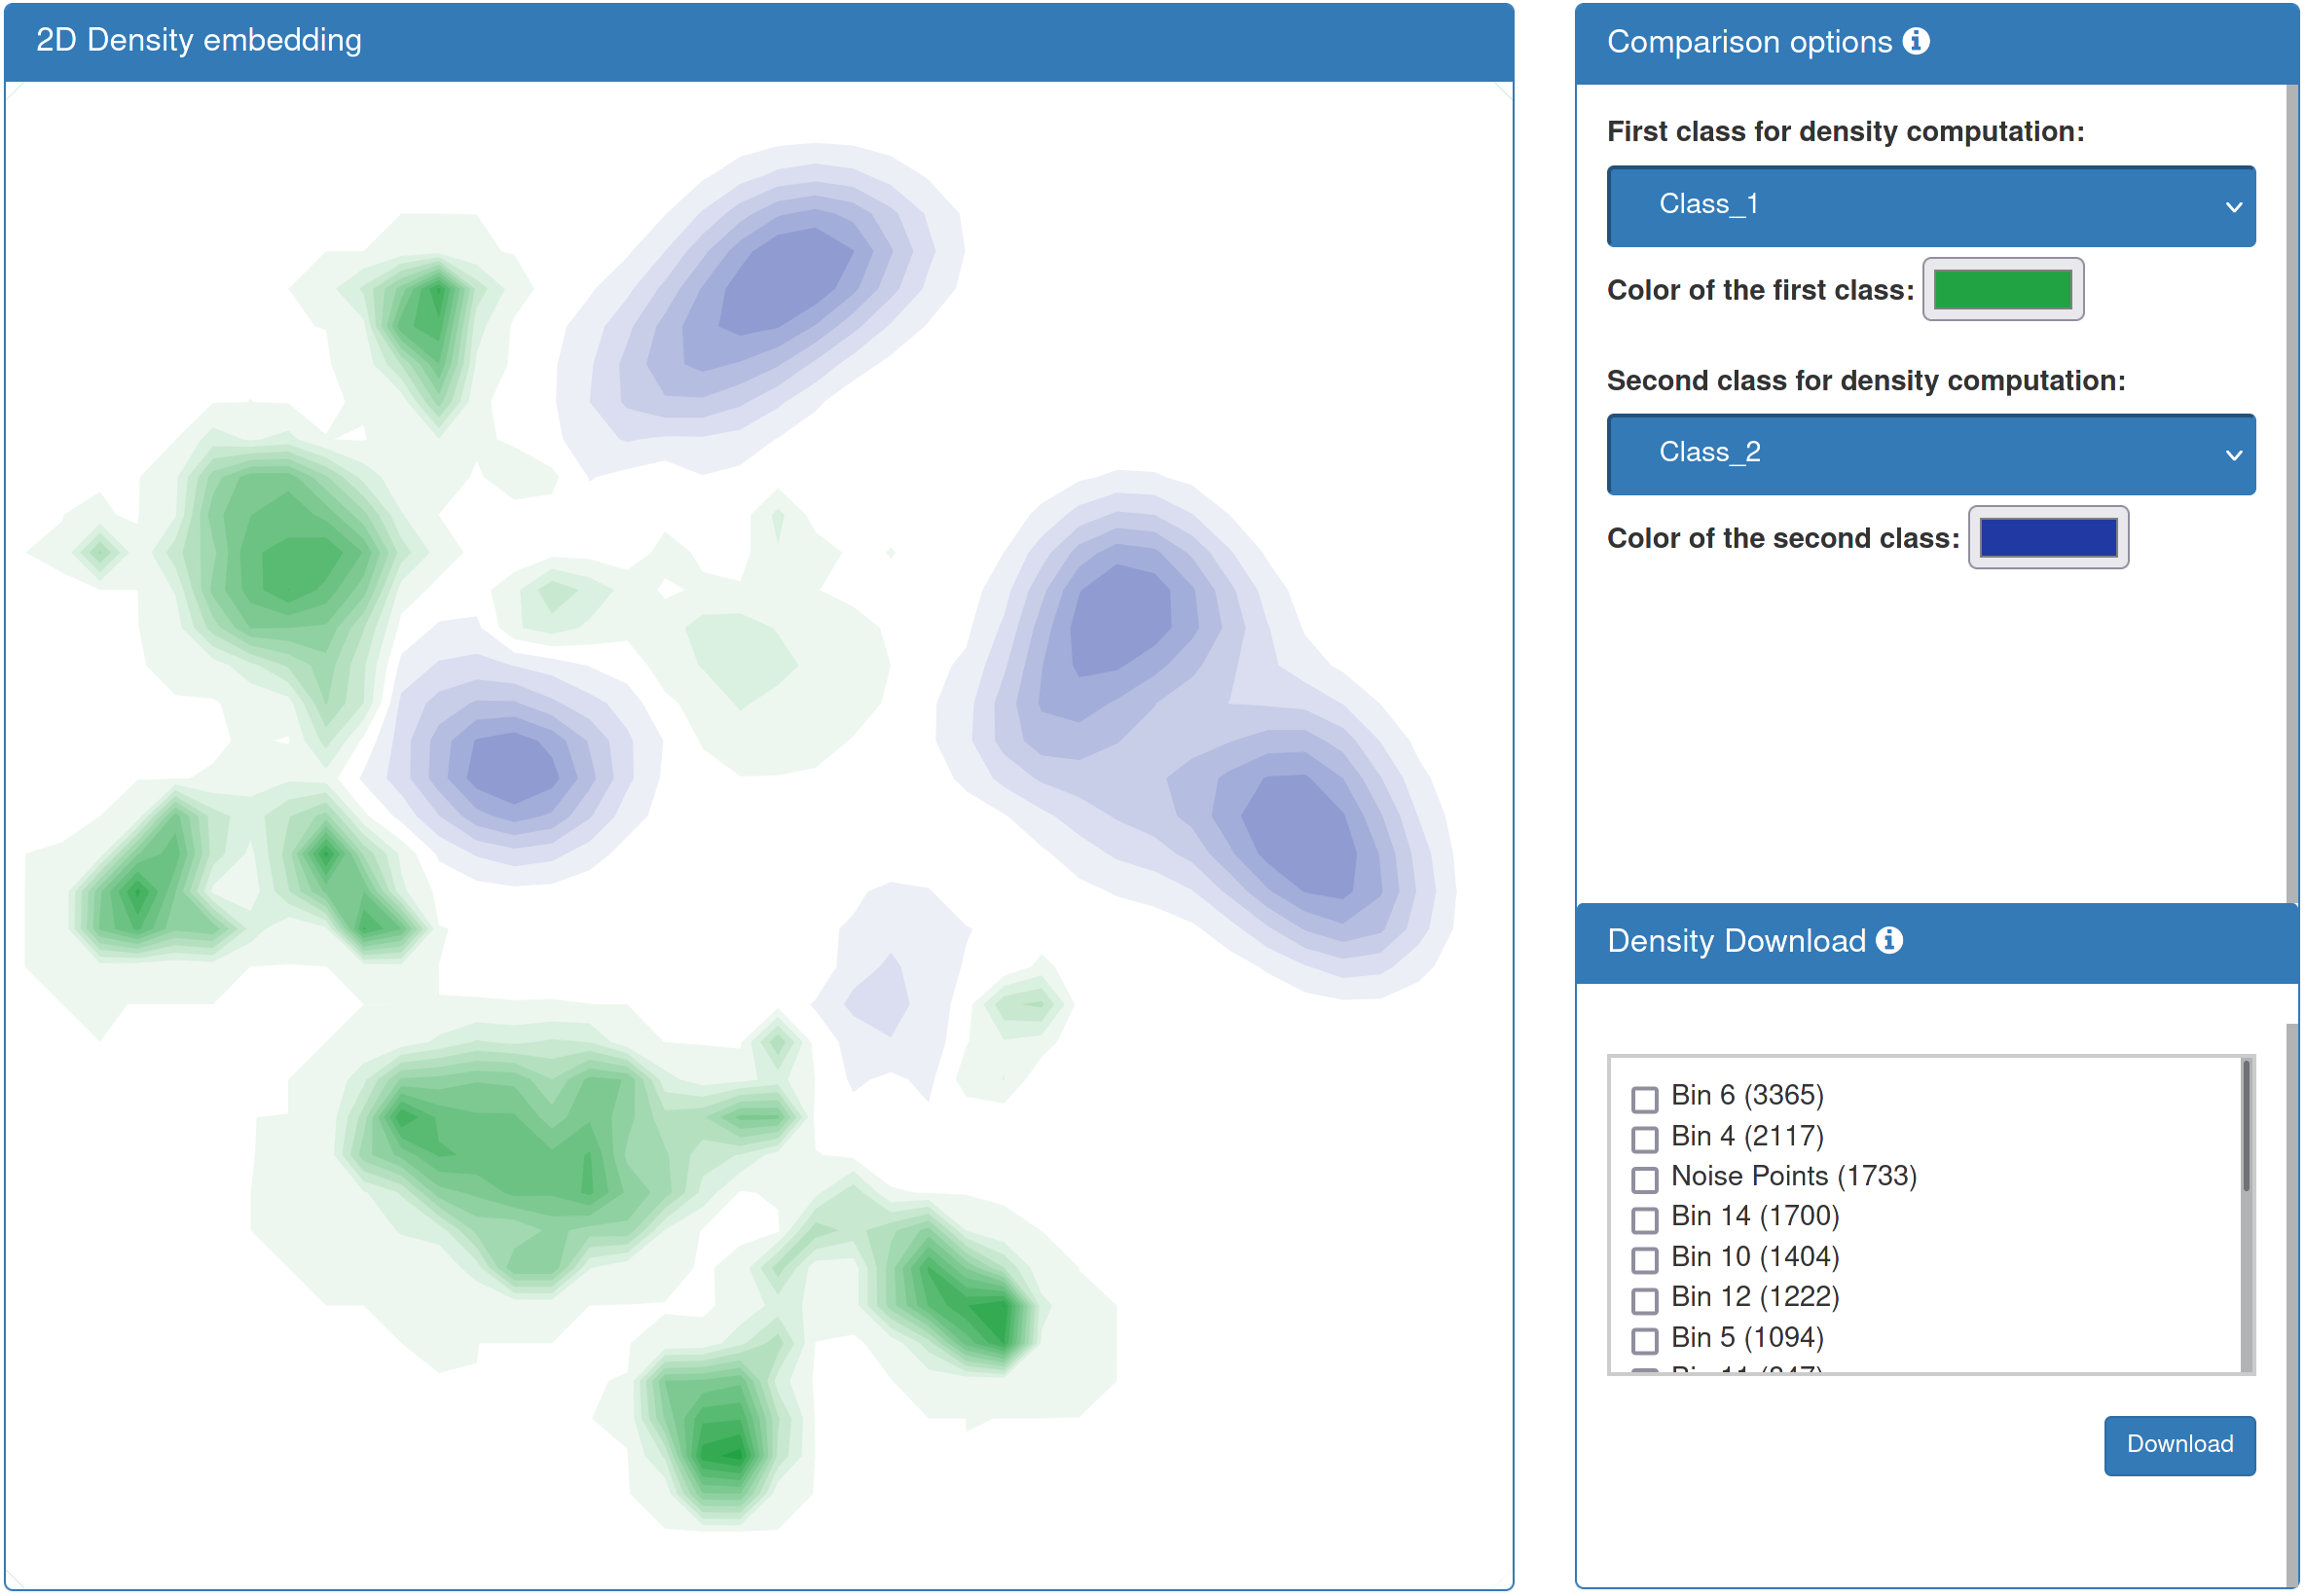
| If you added annotation data, the result page presents a differential density representation of your data. To this end, datapoints are blurred with a Gaussian kernel, signals are accumulated for each sample, and the two density fields of the classes specified on the right are substracted from one another. Differential density values for the different clusters can be downloaded. |
 |
| The BusyBee webserver provides the presented results either as images of the individual plots or the underlying data as a zipped download. The download represents a condensed version of the data which is generated during the processing. Should you be interested in the full set of generated data, please contact us. | 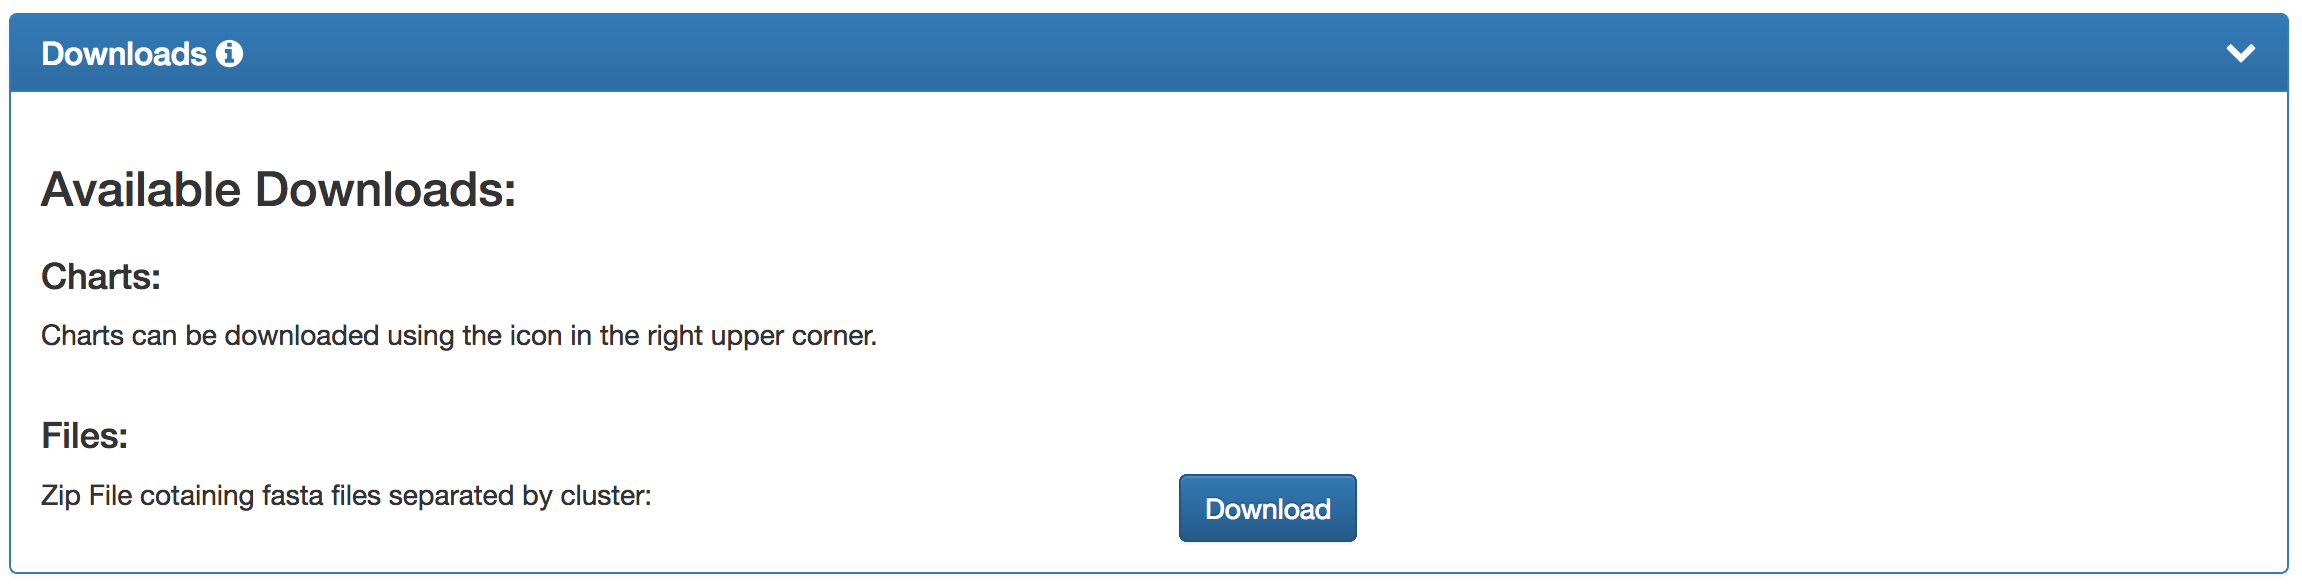 |
|
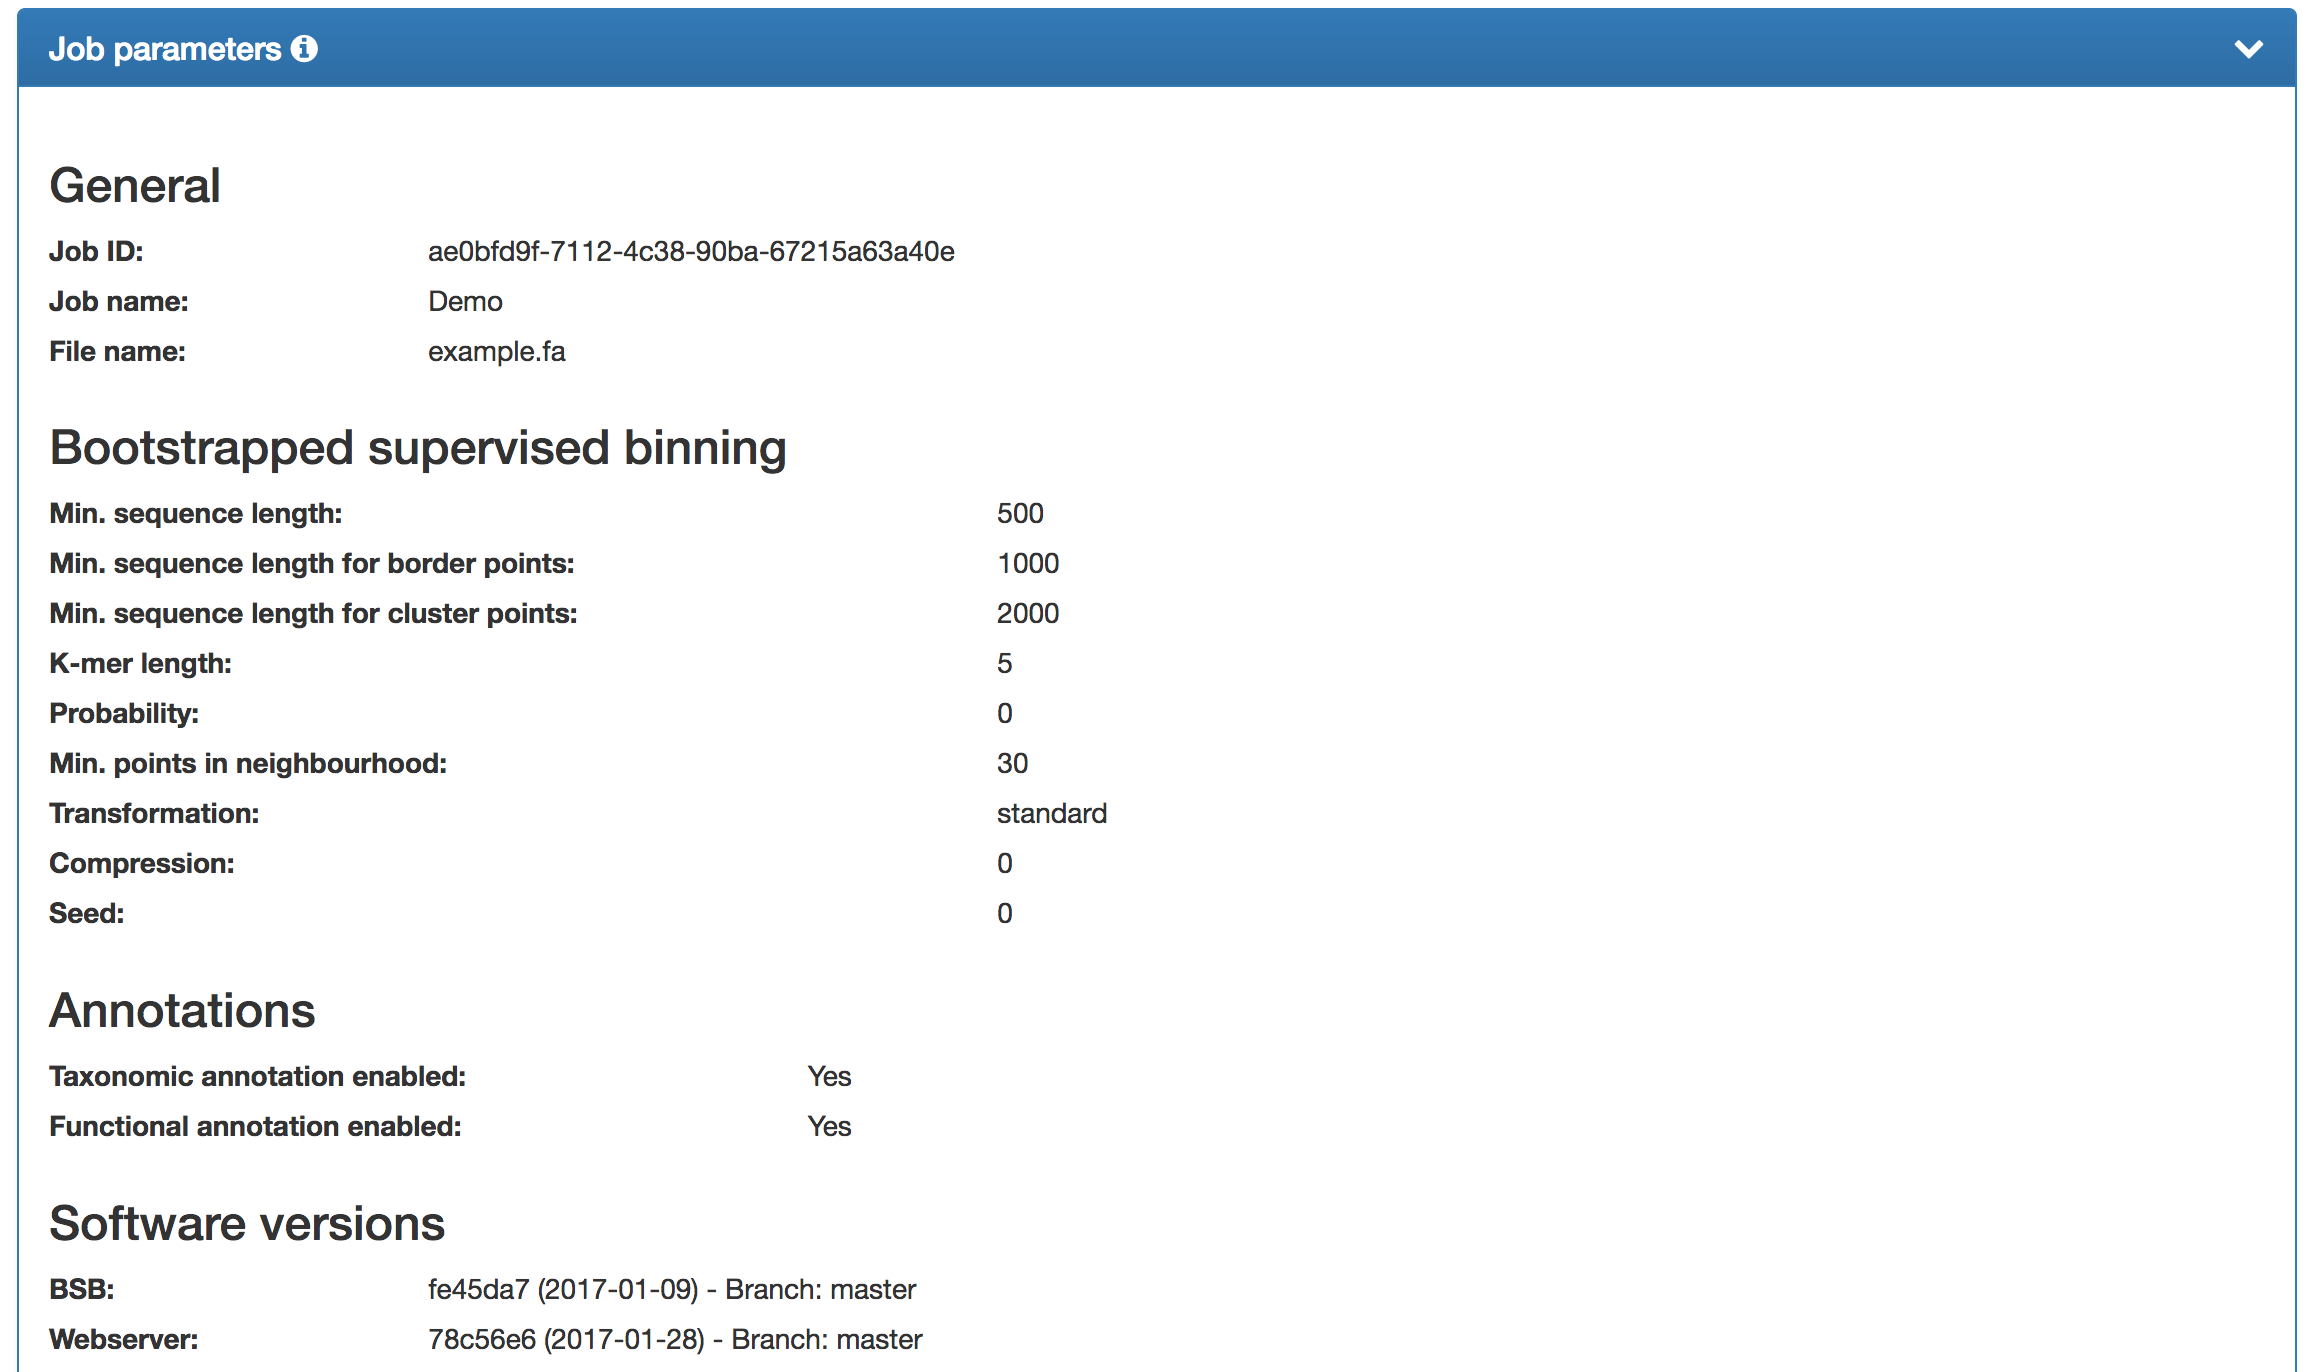
An overview of the options and parameter values, including the job ID, job name, minimum sequence length, etc., is shown at the bottom of the results page (truncated version shown). The software versions are also listed. In case of a step other than the binning failing, a "Failure" (instead of "Yes"/"No") will be shown. Please visit the F.A.Qs" and/or contact us in these cases. |
 |